While the census can describe the population structure of a place at some point in time, it can also provide an understanding of the population structure among many places. The census data are tabulated in varying levels of detail over space, and very often important information can be gathered by looking at the areal differences in the population structure.
Maps do provide an important overview of the spatial relationships of a data set, but there are a number of other questions that are sometimes asked about spatial distributions. For example, one might want to locate the center of a distribution of customers for a warehouse, find the shortest route to a destination, form voting districts or school districts, or estimate what areas surrounding a city are most likely to grow and what facilities may be needed there. What makes these questions different from other demographic questions is that answering them requires a knowledge of the location of features.
- A. Service Areas
Because the census contains a latitude and longitude value for the center point of each geographic unit, various distance calculations can be made. One common calculation done by market researchers is to compute the number of persons or potential customers within a one-mile or a three-mile radius of a given location. This is helpful in deciding if a market is underserved or overserved by a given type of business.
Since the centers of the geographic units in the census are specified in latitude and longitude, the actual distance in miles between these centers measured on the surface of the earth may be approximated by the following equation:
-
Cos (Distance) = Sin (lat a) * Sin (lat b) + Cos (lat a) * Cos (lat b) * Cos (difference of long a and long b)
-
where "lat" is latitude and "long" is longitude and a and b are two points on the earth.
The final answer is multiplied by 69.11, the approximate number of miles per degree on the earth. The equation necessary to convert latitude and longitude differences into distance in miles on the surface of the earth is shown below. Note that degrees of arc must be converted to radians (i.e. a length of arc equal to the radius of its circle) for use in computer trigonometric functions. Thus 360o of a circle equals 2p radians. To convert degrees to radians multiply by p/180 and to convert radians to degrees multiply by 180/p.
For computational purposes, the above equation may be stated as:
= 180/p * (ACOS ((SIN(p/180*lat_1) * SIN(p/180*lat_2)) + (COS(p/180*lat_1) * COS(p/180*lat_2) * COS(p/180*ABS(long_1 - long_2))))) * 69.11
where lat_1, long_1 and lat_2, long_2 are the latitude and longitudes of two points.
For relatively small areas, the earth may be treated as flat and the Euclidean distance equation (D = square root of the sum of the squares of the differences in x and y) may be used. However, one must still compensate for the shortened distance between degrees of longitude that occurs as one moves away from the equator. Below, the difference in degrees of latitude may be multiplied by 69.11 (miles in a degree) and squared. The difference in degrees of longitude must be multiplied by the cosine of the latitude, the radius of the earth (3959 miles) and one degree of the earth's circumference before it can be squared.
-
= sqrt( ( diff in lat * 69.11)2 + ((diff in long) * cos(lat) * p/180 * 3959)2 )
=SQRT (ABS(Diff_in_lat) * 69.11) **2 + (ABS(Diff_in_long) * COS(p/180*Lat)) * 3959)**2)
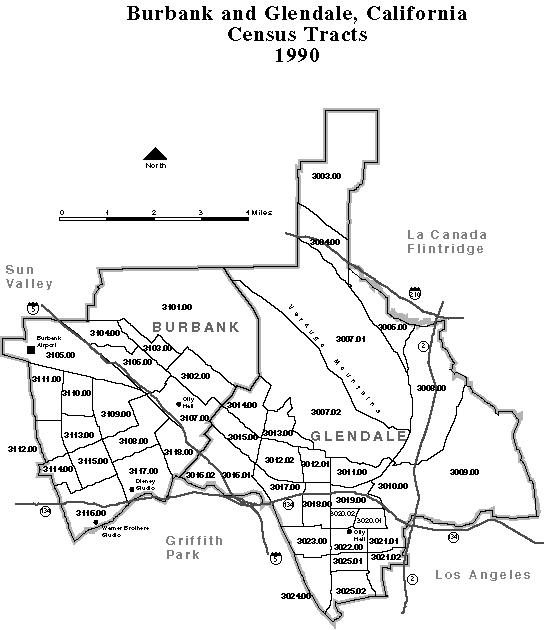
In the table below, Glendale Tract 3019.00 was selected as a site for a facility. We need to know how many people live within a one-mile radius of the selected tract. Using the tabled values of latitude and longitude for each tract centroid, the distance in miles from each tract to 3019.00 was calculated. The tracts were then sorted by increasing distance of their centroids from tract 3019.00. There are 59,905 people whose tract centroids are within a 1 mile radius of tract 3019.00.
The filter for inclusion or exclusion is whether a tract centroid falls within the circle radius. If more precision is required, one might use block-level data or use GIS software to overlay the ring onto the tracts and then allocate the population to the ring based on the amount of area of each tract that it covers.
Figure 4. Burbank and Glendale Census Tracts, 1990

| Glendale Tract | Longitude | Latitude | Population | Distance in Miles |
| 3019.00 | -118.247 | 34.155 | 6,123 | 0 |
| 3020.00 | -118.245 | 34.149 | 10,389 | 0.5 |
| 3011.00 | -118.246 | 34.162 | 5,844 | 0.5 |
| 3018.00 | -118.259 | 34.153 | 6,969 | 0.7 |
| 3010.00 | -118.231 | 34.158 | 4,845 | 0.9 |
| 3022.00 | -118.247 | 34.142 | 8,791 | 0.9 |
| 3021.01 | -118.236 | 34.144 | 9,290 | 1.0 |
| 3012.01 | -118.260 | 34.164 | 7,654 | 1.0 |
| 3023.00 | -118.262 | 34.143 | 9,256 | 1.2 |
| 3025.01 | -118.249 | 34.138 | 8,966 | 1.2 |
| 3017.00 | -118.271 | 34.154 | 7,891 | 1.4 |
| 3021.02 | -118.236 | 34.135 | 6,668 | 1.5 |
| 3012.02 | -118.273 | 34.164 | 7,005 | 1.6 |
| 3007.00 | -118.262 | 34.178 | 5,459 | 1.8 |
| 3024.00 | -118.259 | 34.131 | 5,477 | 1.8 |
| 3025.02 | -118.250 | 34.129 | 7,101 | 138 |
| 3013.00 | -118.271 | 34.174 | 1,974 | 1.9 |
| 3008.00 | -118.220 | 34.185 | 6,668 | 2.5 |
| 3015.00 | -118.288 | 34.173 | 8,133 | 2.7 |
| 3016.00 | -118.293 | 34.164 | 10,667 | 2.7 |
| 3014.00 | -118.282 | 34.182 | 3,606 | 2.7 |
| 3009.00 | -118.200 | 34.162 | 6,800 | 2.7 |
| 3006.00 | -118.237 | 34.207 | 6,080 | 3.6 |
| 3005.00 | -118.231 | 34.216 | 9,060 | 4.3 |
| 3007.01 | -118.272 | 34.222 | 5,609 | 4.8 |
| 3002.00 | -118.238 | 34.228 | 4,655 | 5.1 |
| 3004.00 | -118.255 | 34.229 | 5,211 | 5.1 |
| 3001.00 | -118.235 | 34.242 | 5,744 | 6.0 |
| 3003.00 | -118.253 | 34.251 | 6,009 | 6.6 |
- B. Centers of Population
Often it is desirable to look at an entire distribution of points and find a point that is located centrally to all others. For example, if one were locating a warehouse or an office to serve customers one might want to choose a location that would minimize the travel for the greatest number of people. One might also compute such a value at different time periods in order to determine in which direction and how far the population is shifting. This has been done each decade for the entire United States to track the westward shift of population from the east coast.
- The Mean Center
One simple calculation of the center of population is the center of gravity or mean center. This may or may not be weighted by the population of each of the points, but it usually is weighted. In the table below, a portion of the census tracts in Glendale are shown along with their non-Hispanic white populations for 1980 and 1990. The location of the center of population for each decade is shown at the bottom. From this we can see that the center of non-Hispanic white population has shifted west and south from 1980. Using the distance equation from above indicates that the shift was 0.21 miles. Glendale actually gained non-Hispanic white population during this decade, a trend that was counter to most areas in Los Angeles County. Much of this gain is likely due to the large number of Armenian immigrants who have settled in Glendale during the 1980s.
|
Tract |
Longitude |
Latitude |
1990 NHWhite |
1980 NHWhite |
Long x 1990 Pop |
Lat x 1990 Pop |
Long x 1980 Pop |
Lat x 1980 Pop |
|
3101.00 |
- 118.311 |
34.216 |
4303 |
4393 |
- 509,093.91 |
147,231.018 |
- 519,741.93 |
150,310.449 |
|
3102.00 |
-118.299 |
34.190 |
6352 |
6128 |
-751,435.87 |
217,173.927 |
-724,936.87 |
209,515.401 |
|
... |
... |
... |
... |
... |
... |
... |
... |
... |
|
3025.02 |
-118.250 |
34.129 |
3167 |
2863 |
-374,497.41 |
108,086.86 |
-338,549.44 |
97,711.613 |
|
|
|
|
|
|
|
|
|
|
|
|
|
SUM |
193,857 |
185,894 |
-22,928,530 |
6,625,513 |
-21,987,087 |
6,353,818 |
|
|
|
Mean |
|
|
-118.275 |
34.177 |
-118.278 |
34.180 |
- Population Potential
When one wants to calculate the minimum distance between a given set of points it is possible to determine which of the points has the least overall distance to all other points. This statistic is called the population potential or aggregate accessibility index. The existing set may be the total set of tracts or they may be a special set of points such as potential shopping center locations.
-
n
Accessibility Index = S (Pi /di j)
i=1
Here Pi is the population of each area and d is the distance from a potential location to the centroid of the population area. The result will be in persons per mile. The higher this value, the greater the accessibility of a selected site to all other people.
In the table below Glendale tract 3013.00 is compared to tract 3019.00 as a potential site for a service center. Here tract 3019.00 has a higher aggregate accessibility index of 138,770 persons per mile and is relatively more accessible to the population than is tract 3013.00
|
Tract |
1990 Population |
Distance to 3019.00 |
Pop / Distance to 3019.00 |
Distance to 3013.00 |
Pop / Distance to 3013.00 |
|
3001.00 |
5744 |
6.0 |
952.8 |
5.1 |
1127.1 |
|
3002.00 |
4655 |
5.1 |
918.8 |
4.2 |
1114.9 |
|
3003.00 |
6009 |
6.6 |
906.1 |
5.4 |
1114.3 |
|
3004.00 |
5211 |
5.1 |
1015.3 |
3.9 |
1339.9 |
|
3005.00 |
9060 |
4.3 |
2130.5 |
3.6 |
2495.0 |
|
... |
... |
... |
... |
... |
... |
|
3013.00 |
1974 |
1.9 |
1027.8 |
0.0 |
0.0 |
|
... |
... |
... |
... |
... |
... |
|
3019.00 |
6123 |
0.0 |
0.0 |
1.9 |
3188.4 |
|
3025.02 |
7101 |
1.8 |
3892.4 |
3.4 |
2115.4 |
|
|
|
|
|
|
|
|
|
|
Accessibility (Sum) |
138,770 |
|
105,028 |
One problem with this index is how to handle the population of the tract serving as the temporary center. A typical solution is to use a half the distance to the nearest tract since it is likely that persons in that tract would be scattered within it. Thus, tract 3019.00 would pick up an additional 24,492 persons per mile (6,123 / .25) and tract 3013.00 would gain an additional 3423.

