
ArcView 3.0 is a mapping product from ESRI which provides a simple,
more user-friendly access to manipulating and displaying spatial data.
It may be used to display Arc/Info coverages, view images and vector data,
make logical queries of the data, save graphics and data for other applications,
and do simple address matching. The software does not provide the
map creation and analytical tools of Arc/Info, for it is intended more
as a tool for examining spatial data.
Currently ArcView runs on IBM, Mac, and Unix platforms. It comes with
sample files for exploration, but more extensive datasets such as ArcUSA
can be purchased. ArcUSA comes in a detailed, 1:2,000,000 county-level
version and a smaller, 1:25,000,000 version. The latter version runs
more quickly, but has fewer data sets to explore. In addition, you
may view any Arc/Info coverages you have with this product.
A Brief Overview

ArcView begins with a Project. A Project contains the various
components of a job. A Project file can be recognized by a .apr
suffix attached to its name.
Projects contain Views, Tables, Charts, Layouts and Scripts. To
the right, these components are displayed when a new project is opened.
Views contain the map window, Tables are the attributes for the map, Charts
contain a window for graphing data, Layouts contain a window for composing
a display from various other windows, and Scripts contain a window for
running customized programs.

A View is a map that is dynamically linked to a set of attributes.
A user can customize a View by manipulating the data and the symbology
used to construct it. Different Views of the same data may be created
at the same time by a single user or by several users.
A View (ie map) actually consists of a set of data sets called Themes.
Buildings, wells, roads, streams, census tracts, and landuse zones are
examples of some of the Themes found in a View. Any Theme typically
has various Attributes (Fields) from which you might create subsets
for display. For example, you might display census tracts and then
select the Population Density attribute from which you then subset only
those tracts which have densities greater than 10,000 persons per square
mile.
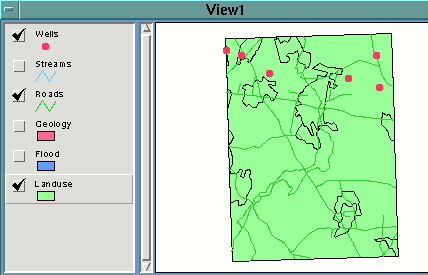
The various Themes are shown in a Table of Contents window. (The left
side of View1)
To make a Theme visible on the map you need to click on a small box
to the left of a Theme label so that a small check appears. See Wells,
Roads, and Landuse.
You may also select various Themes for further manipulation by simply
clicking on them in the Table of Contents. (Note the rectangular
highlight around Landuse.) You may also control the order in which
Themes are drawn by clicking on one and dragging it to the top or bottom
of the Table of Contents window.
Above is a basic ArcView display of some sample data from the file Scantic.apr
On the left side is the Table of Contents. Various Themes (Wells,
Roads, Landuse.) are shown in the order they will be displayed top to bottom.
Streams, Geology, and Flood are not checked and so will not be shown in
the map. The outlines of the Landuse polygons are shown because no
Attribute such as the Landuse Code has been selected to distinguish between
the polygons.
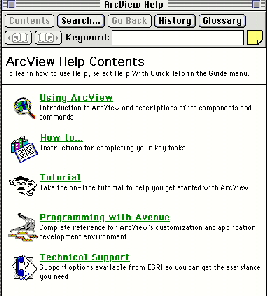
HELP!
ArcView has an extensive help system. Select the Help menu
and the window shown below will appear. Clicking on any of the green-colored
words will take you to additional explanation of that topic. Note you can
search by keyword.
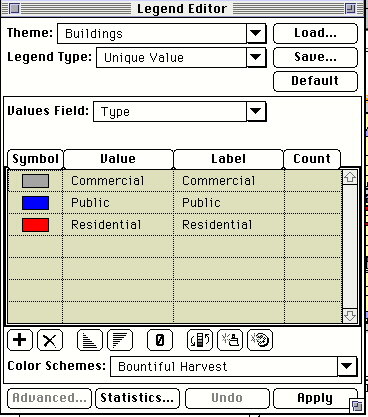
Other Windows
Other windows will appear when various buttons and objects are selected.
In particular, double-clicking on one of the Themes in the legend opens
the Legend Editor which presents significant options.
Shown to the right is the window for the "Buildings" Theme. Several
useful alterations may be made here. You can change the name of a
class. You can change the number of classes and the way a range of
numbers is grouped with the Legend Type window. You can change the colors
by either double-clicking on the Symbols' colored box or by selecting the
Ramp or Random buttons. You can also change Themes here by selecting the
down-pointing arrow to the right of the Theme: button. (Note that
Buildings is currently selected.)
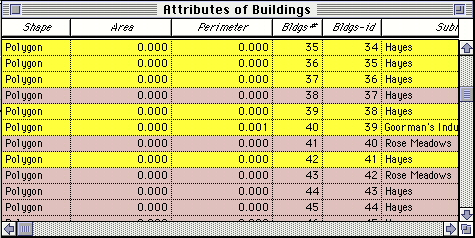
The Table option ![]()
Shown below is the window that appears when the Open Theme Table option
is selected. Each of the Attributes for the Theme "Buildings" is
listed at the top of a column while each building is listed as a row.
New tools at the top of the View window can be used to select subsets
of a particular Attribute.
Changes and subset selections made in the Attribute window also will
be displayed on the map at the time they are made.

The Properties Option ![]()
This option makes general changes to an entire Theme. For example,
you can subset the elements to appear on the map with a "Definition:" statement.
You may select a label and how it is positioned next to a symbol or you
may even limit the scale at which the Theme will be active.

