Note to the Instructor: This is the second in a series of three exercises that focus on religious similarity and dissimilarity between respondents and their spouses and partners. We'll develop an overall measure of religious similarity and look more closely at respondents who are not similar to their spouses and partners in religious preference. In these exercises we're going to analyze data from the Pew 2014 Religious Landscape Survey conducted by the Pew Research Center. We're going to use SPSS to analyze the data. A weight variable is automatically applied to the data set so it better represents the population from which the sample was selected. You have permission to use this exercise and to revise it to fit your needs. Please send a copy of any revision to the author so I can see how people are using the exercises. Please contact the author for additional information.
Goal of Exercise
The goal of this exercise is to explore religious similarity and dissimilarity between respondents and their spouses or partners. We'll develop an overall measure of religious similarity and look more closely at respondents who are not similar to their spouses and partners in religious preference. The next exercise (Religion_3SPR) will look to see whether similarity and dissimilarity vary by sex and age.
Part I – The Data Set We'll be Using
The Pew Research Center has conducted a number of surveys that deal with religion. Two of these surveys are the Religious Landscape Surveys conducted in 2007 and then repeated in 2014. They were very large telephone surveys of about 35,000 adults in the United States. For more information about the surveys, go to their website.
We'll be using a subset of the 2014 survey in this exercise which I have named Pew_2014_Religious_Landscape_ Survey_subset_for_classes.sav. For the purposes of these exercises I selected a subset of variables from the complete data set. I recoded some of the variables, created a few new variables, and renamed the variables to make them easier for students to use. There is a weight variable which should always be used so that the sample will better represent the population from which the sample was selected. To open the data set in SPSS, just double click on the file name.[1] Your instructor will tell you where the file is located.
Some of you have used SPSS, the statistical package we're using, and know how to get a frequency distribution. Others of you are new to SPSS. There is a tutorial that you can use to learn how to get a frequency distribution. The tutorial is freely available on the Social Science Research and Instructional Center's website. Chapter 1 of the tutorial gives you a basic overview of SPSS and crosstabulations are covered in Chapter 5.
Part II – Developing a Measure of Religious Similarity and Dissimilarity
In the previous exercise (Religion_1SPR) we looked at the relationship between the respondents' religious preference and the preference of their spouse or partner. Let's run that crosstab now. Put R5 in the columns and RS3 in the rows. Don't ask for percents this time. You'll get the observed frequencies by default and that's all that you will need. Your output should look like Figure 1. This is a large table so we're just showing the top left part of the table.
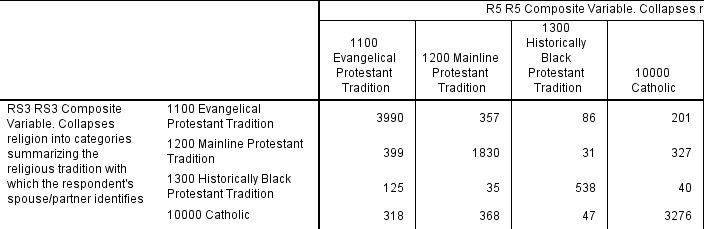
Figure 1
The upper-left cell represents the respondents who are Evangelical Protestant and whose spouse or partner are also Evangelical Protestant. In other words, they have the same religious preference as their spouse or partner. There are 3,990 of them. Moving over one column to the right we have the Mainline Protestants. Look for the number (1,830) of Mainline Protestants whose spouse or partner are also Mainline Protestant. Do this for each religious group in the table. Fill in the appropriate number of cases in Figure 2 for all religious groups.
Now add up all these numbers. That is the number of respondents whose spouse or partner has the same religious preference. The last thing to do is to divide the number of respondents who are religiously similar to their spouse or partner by the total number of cases in the table and convert that to a percent. To get the percent that were religiously dissimilar, just subtract that value from 100.
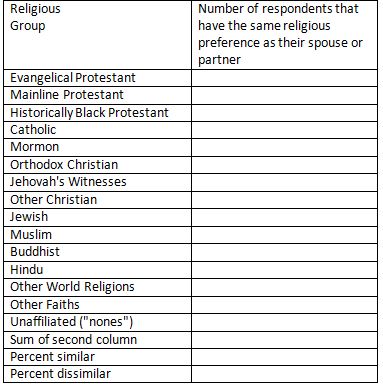
Figure 2
Part III – Exploring Religious Dissimilarity
Instead of just looking at similarity and dissimilarity, let's look more closely at couples who are dissimilar. Rerun the table that you ran in part 2. This time ask for the column percents. Copy by hand the column percents into the table below.[2]
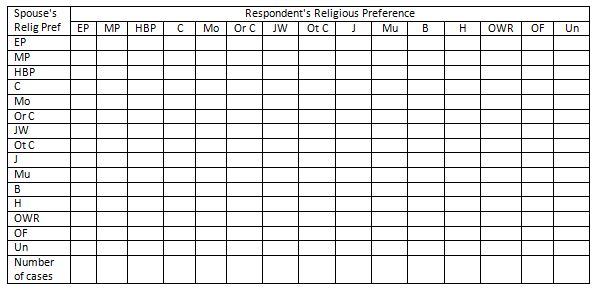
Figure 3
What do Figures 2 and 3 tell us about religious similarity and dissimilarity in the United States? Figure 2 shows that two-thirds (67.7%) of all couples are similar in terms of their religious preference. That is, the respondents and their spouses and partners have the same religious preference.
But what about couples who are dissimilar in their religious preferences? What can we learn from Figure 3 that might help us answer this question? Consider the following questions and write a paragraph answering each question.
- The first eight religious categories are different types of Christians. The last seven categories are different types of non-Christians. How much similarity is there for Christian groups compared to non-Christian groups? (Hint: Think about how you will answer this question. Can you compute two different measures of similarity – one for Christians and another for non-Christians?)
- The four largest Christian groups are Evangelical Protestants, Mainline Protestants, Historically Black Protestants, and Catholics. Let's look at each of these groups separately.
- Evangelical Protestants
- What percent of Evangelical Protestants marry someone who belongs to a Mainline Protestant group?
- What percent of Evangelical Protestants marry someone who belongs to a Historically Black Protestant group?
- What percent of Evangelical Protestants marry someone who is Catholic?
- What percent of Evangelical Protestants marry someone who is religiously unaffiliated?
- Mainline Protestants
- What percent of Mainline Protestants marry someone who belongs to an Evangelical Protestant group?
- What percent of Mainline Protestants marry someone who belongs to a Historically Black Protestant group?
- What percent of Mainline Protestants marry someone who is Catholic?
- What percent of Mainline Protestants marry someone who is religiously unaffiliated?
- Historically Black Protestants
- What percent of Historically Black Protestants marry someone who belongs to an Evangelical Protestant group?
- What percent of Historically Black Protestants marry someone who belongs to a Mainline Protestant group?
- What percent of Historically Black Protestants marry someone who is Catholic?
- What percent of Historically Black Protestants marry someone who is religiously unaffiliated?
- Catholics
- What percent of Catholics marry someone who belongs to an Evangelical Protestant group?
- What percent of Catholics marry someone who belongs to a Mainline Protestant group?
- What percent of Catholics marry someone who belongs to a Historically Black Protestant group?
- What percent of Catholics marry someone who is religiously unaffiliated?
- Evangelical Protestants
Part IV – Conclusions
Now let's put all this together. Write one or two paragraphs summarizing what you learned about religious similarity and dissimilarity. Don't just read back the percents from the tables. Rather, discuss the conclusions that you can draw from these data.
[1] This assumes that the proper associations have been set up on your computer so the computer knows that .sav files are SPSS data files
[2] The religious groupings are abbreviated by using the first two letters of the religious group. See Table 1 for a list of these groups.

